
Summary
This model has an initial resolution of about 0.01 pc and a finest grid after zooming of about 100 AU. Magnetic field is not considered.Simulated using Ramses 3 (MHD)
Parameters
| Parameter | Value |
|---|---|
| boxlen_pc | $66.0948$ |
| cont | 10. !density contrast |
| ff_rt | 0.0 !freefall time/rotation time |
| ff_sct | 0.07 !freefall time/sound crossing time |
| mass_c | 100000. !in solar mass |
| rap | 2.5 !axis ratio |
| time_Myr | $1.16985$ |
| boxlen_codeunits | $66.2167$ |
| cooling | |
| boxlen | 66.2167 |
| courant_factor | $0.8$ |
| gamma | $1.66667$ |
| hydro | |
| jeans_refine | 25*10. ! Allow Jeans refinement anywhere |
| levelmax | $17$ |
| levelmin | $9$ |
| n_sink | 1d9 |
| ncpu | $512$ |
| nexpand | $1$ |
| nstep_coarse | $1600$ |
| nsubcycle | 3*1,10*2 |
| pic | |
| poisson | |
| pressure_fix | |
| r_refine | 10*0.95 |
| riemann | 'hlld' |
| riemann2d | 'hlld' |
| sink | |
| slope_type | $1$ |
| time | $0.0145374$ |
| unit_d | $2.32474e-24$ |
| unit_l | $203947283049827991552$ |
| unit_t | $2539507900000000$ |
| x_refine | 10*0.5 |
| y_refine | 10*0.5 |
| z_refine | 10*0.5 |
Applied physics
- Self-gravity
- Self-Gravity is applied.
- Star formation
- Star formation is treated using Lagrangian sink particles that accrete the surrounding gas and interact gravitationally with it.
- Hydrodynamics
- Hydrodynamical equations are solved
- Magnetohydrodynamics
- Ideal magneto-hydrodynamics is resolved.
- Supernovae feedback
- No supernovae feedback
Snapshots
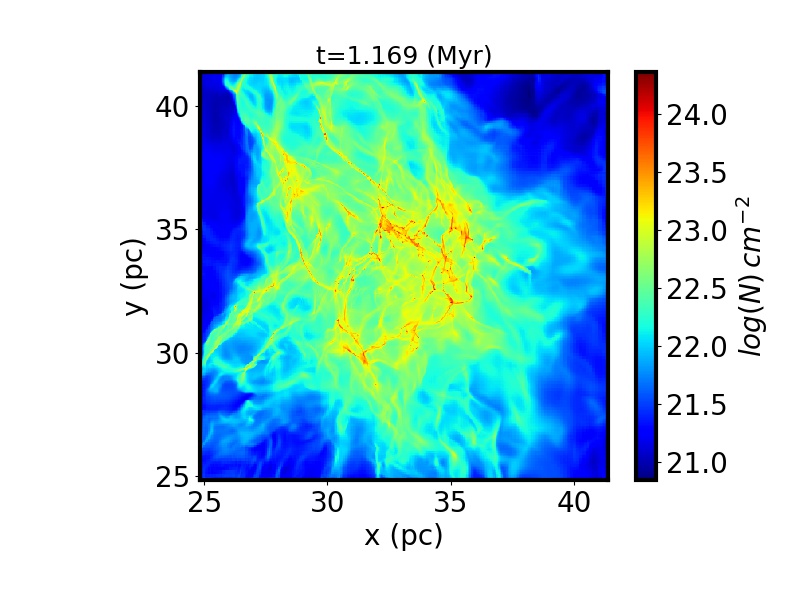
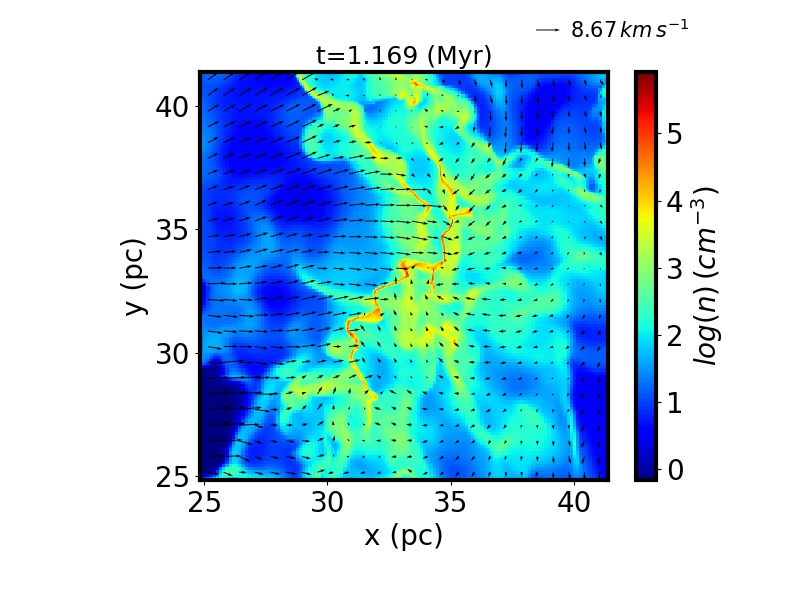
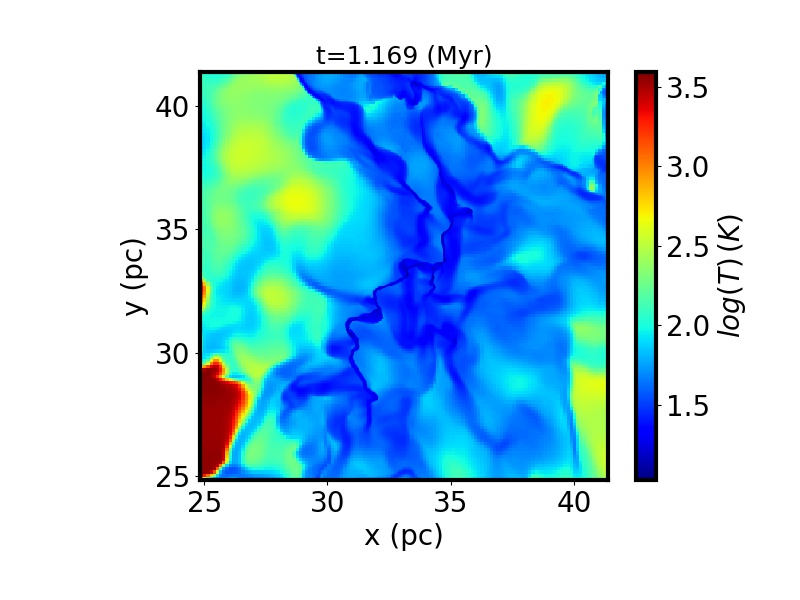
ORION_00066 (t=$1.16985 \; \textrm{kyr}$)
descrip_snapshot
Catalogs :
Datafiles:
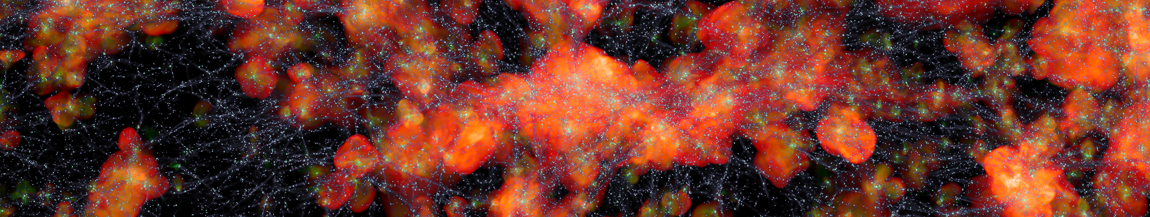
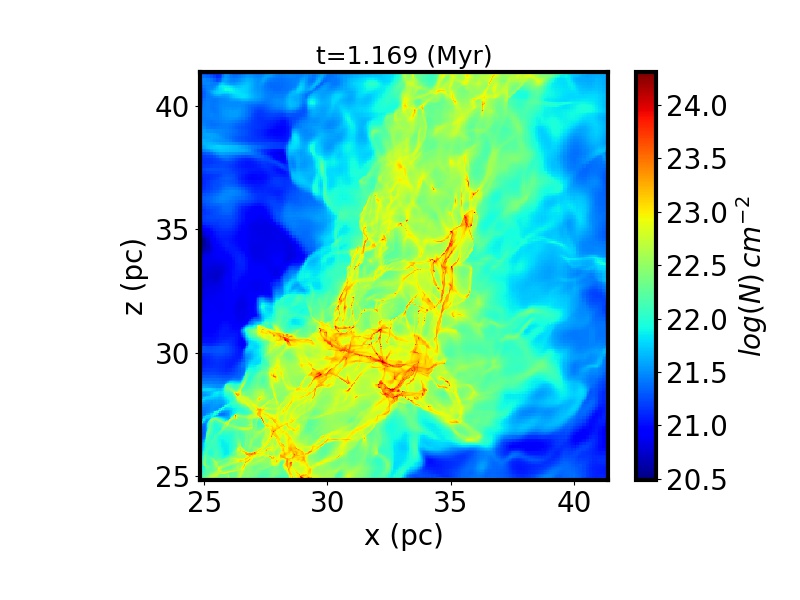
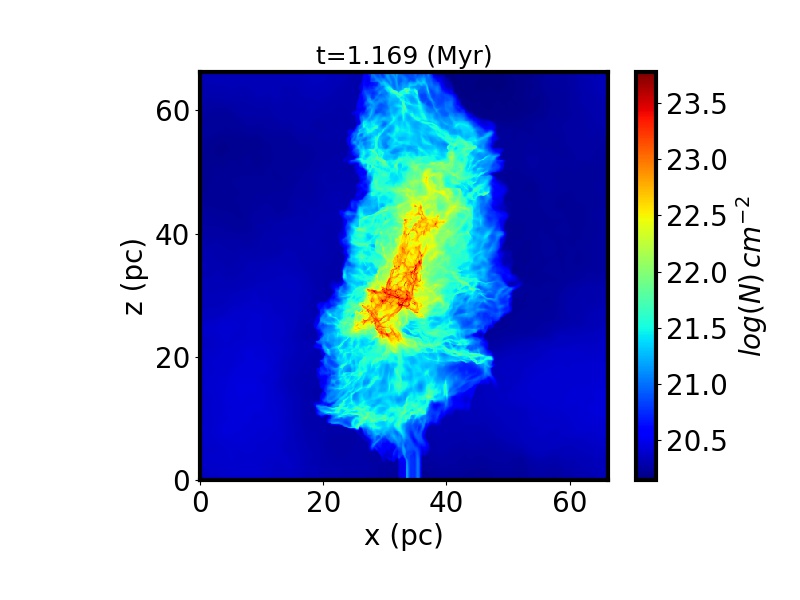
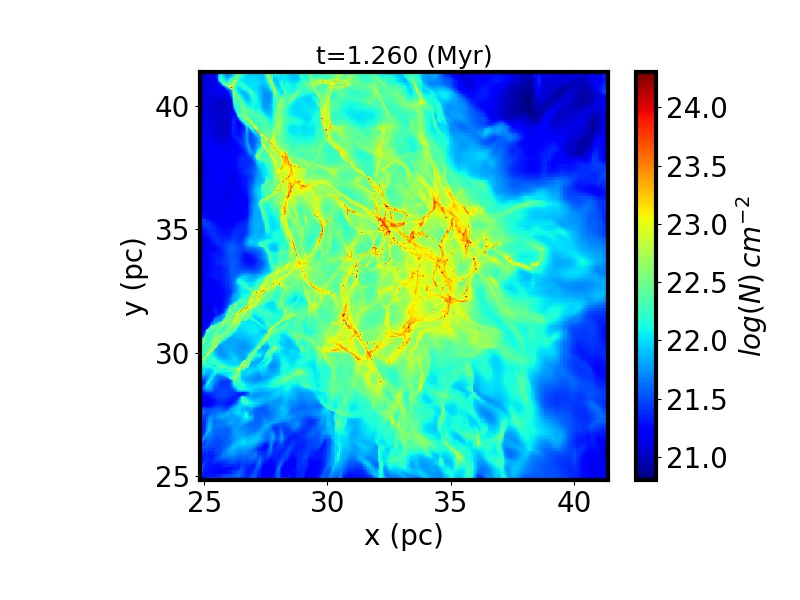
Column density along the z-direction
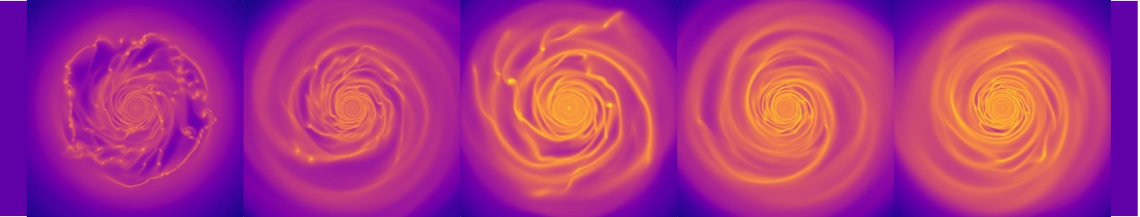
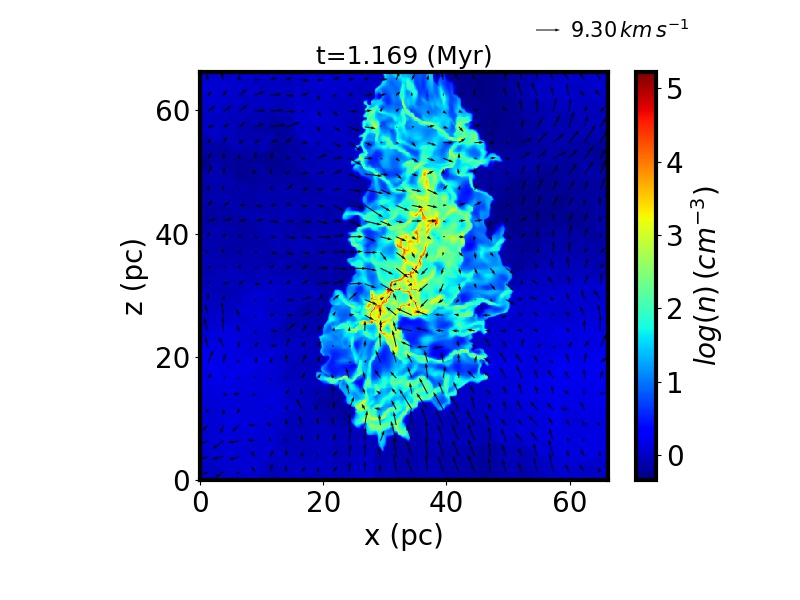
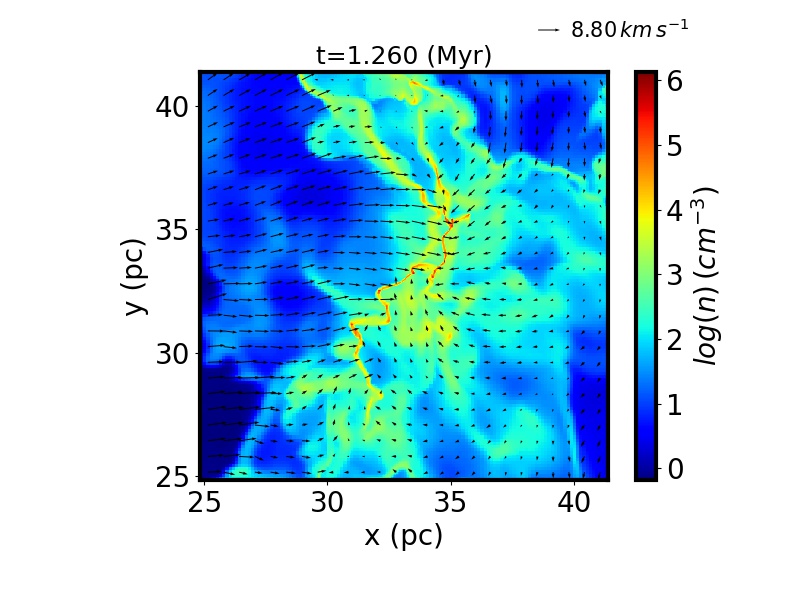
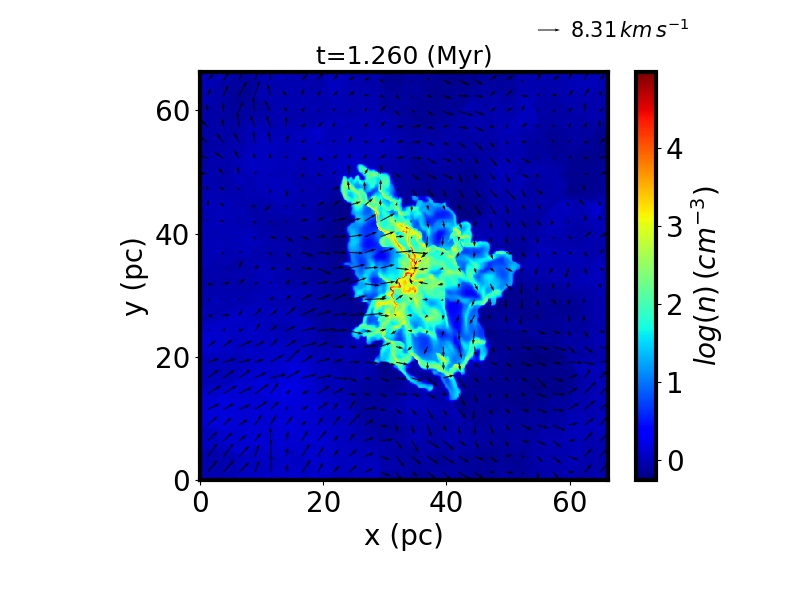
Density in the xy-plane. The arrows represent the velocity field in the xy plane.
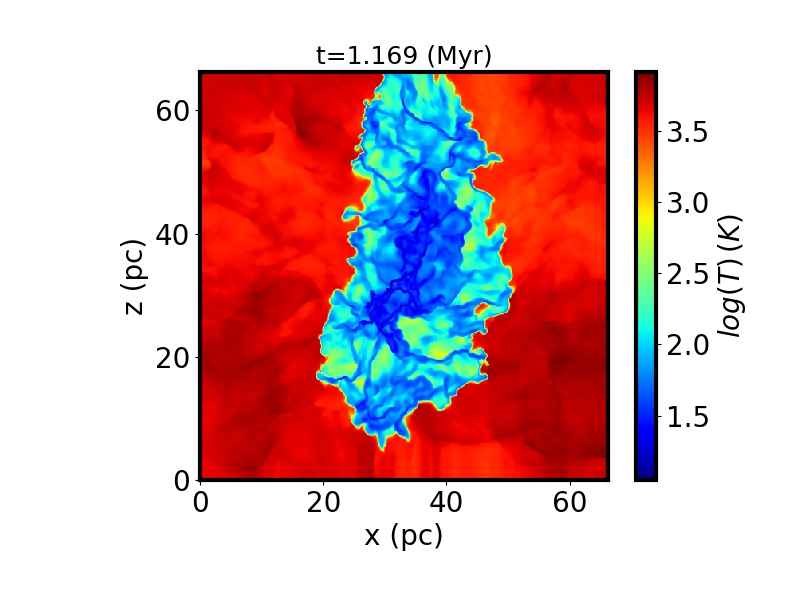
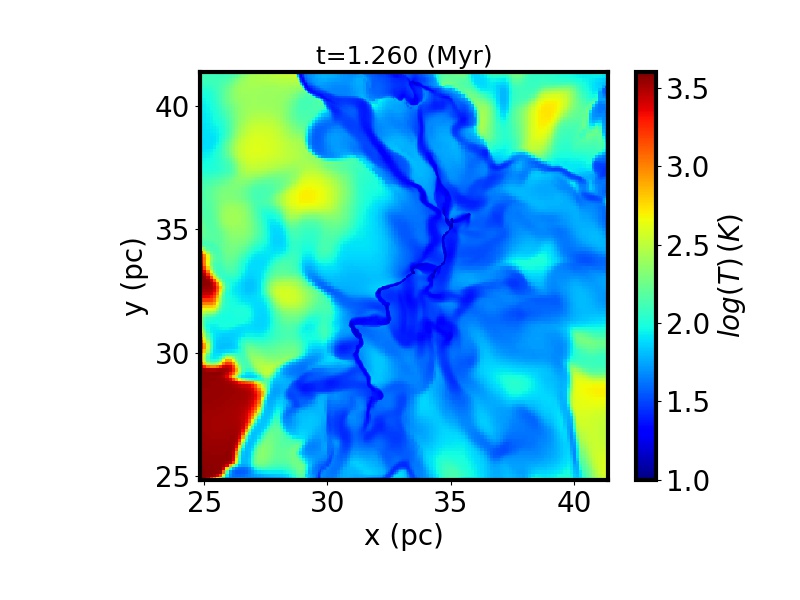
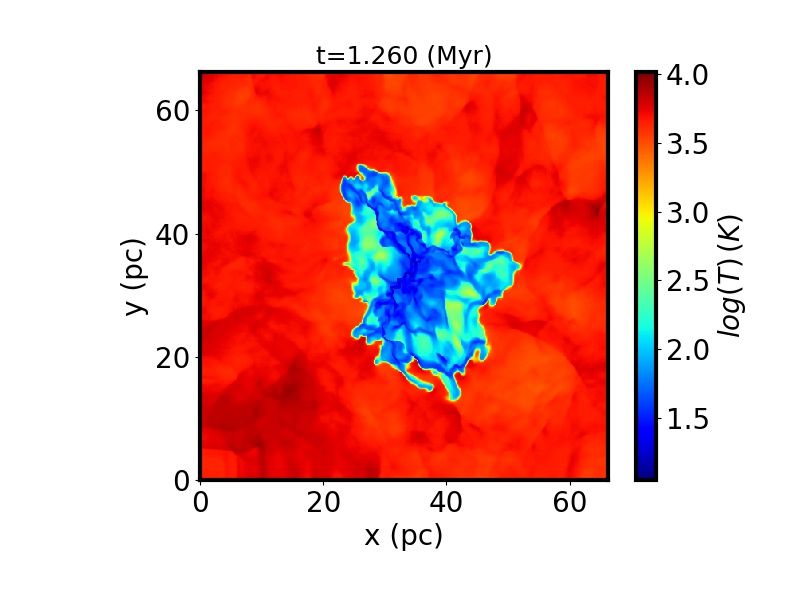
Temperature in the xy-plane.
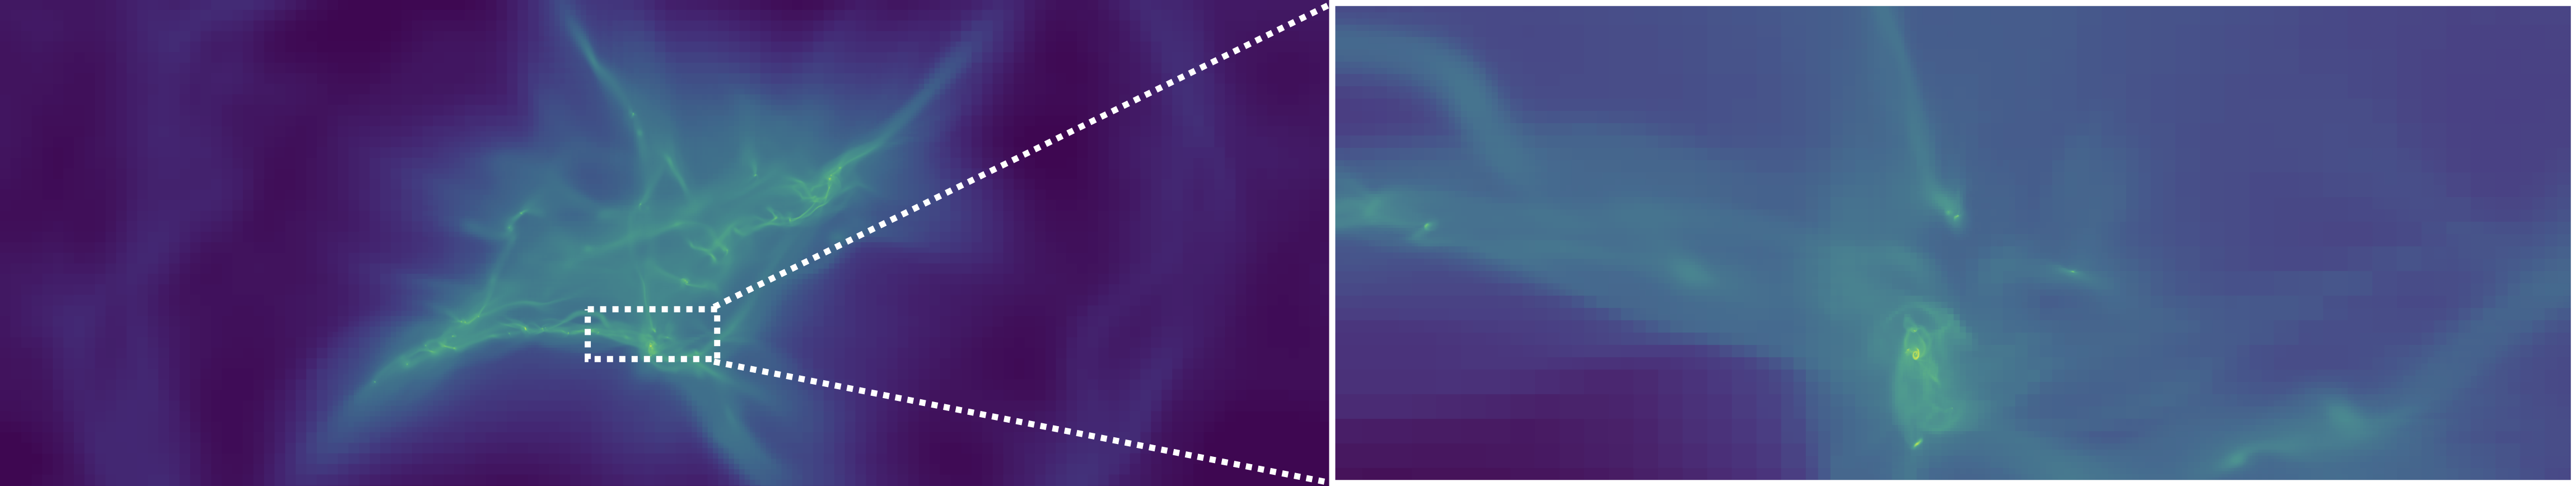
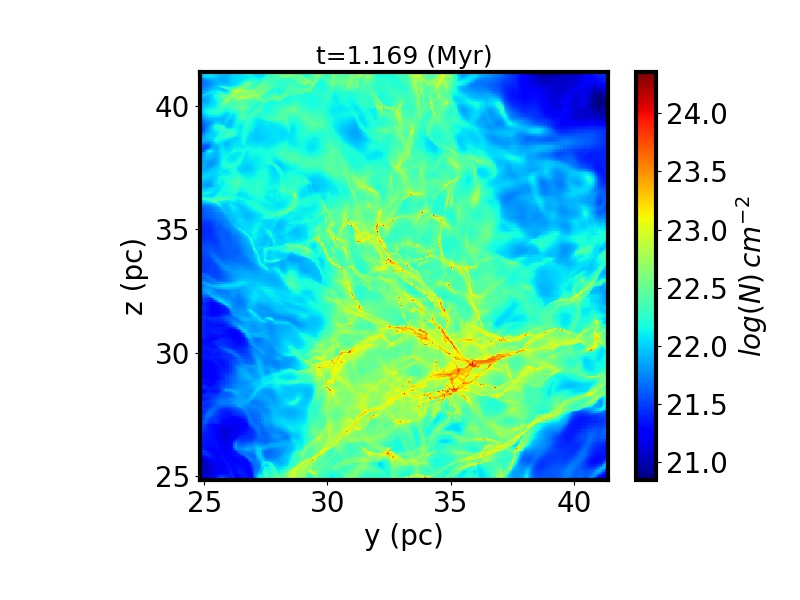
Column density along the y-direction.
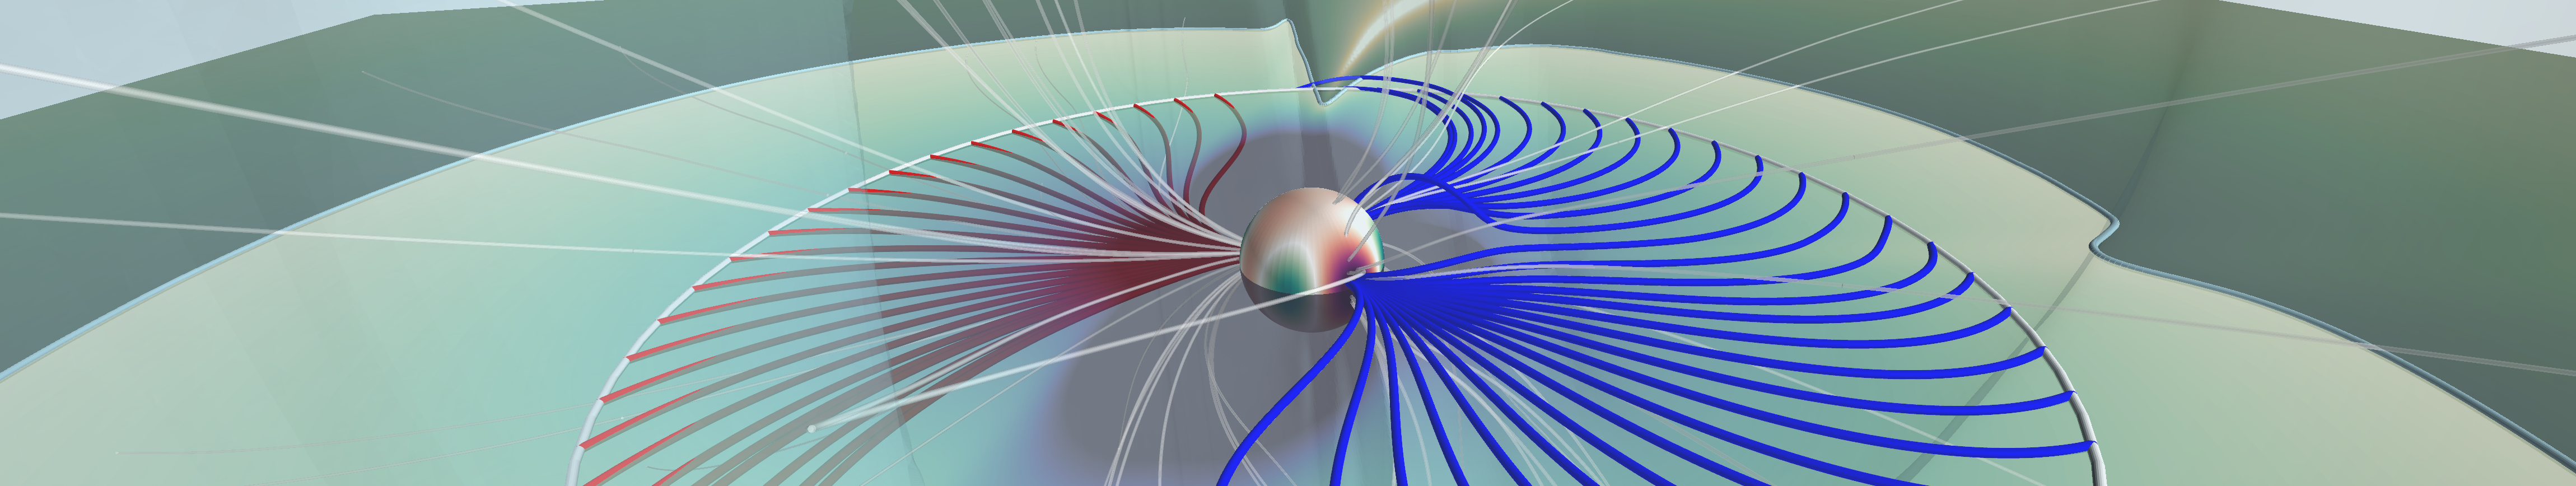
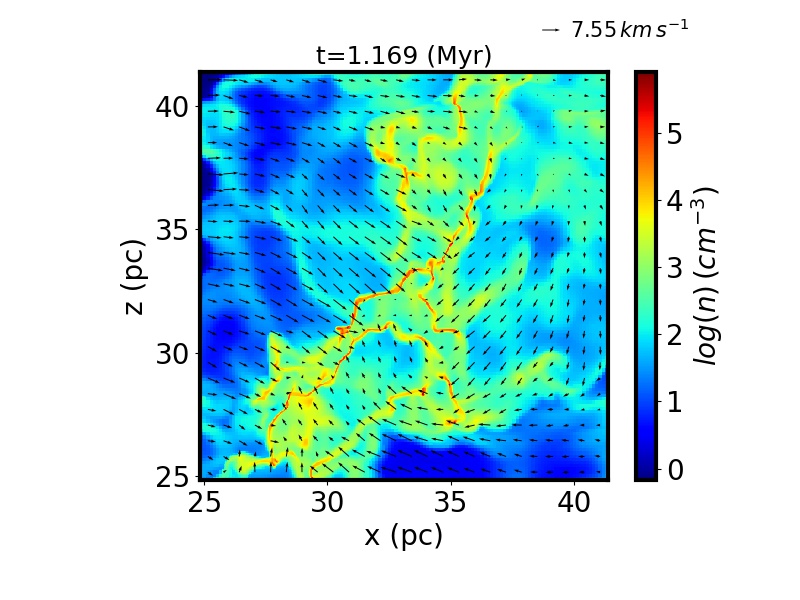
Density in the xz-plane. The arrows represent the velocity field in the xz-plane.
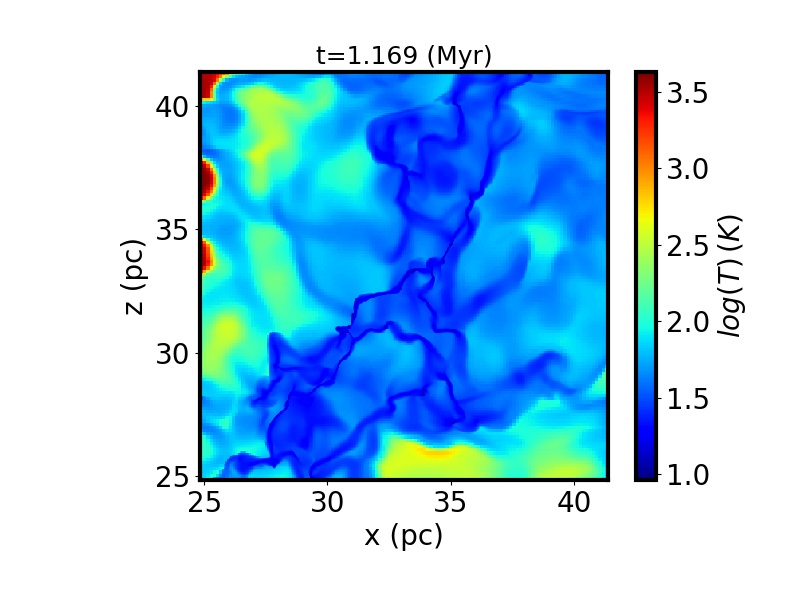
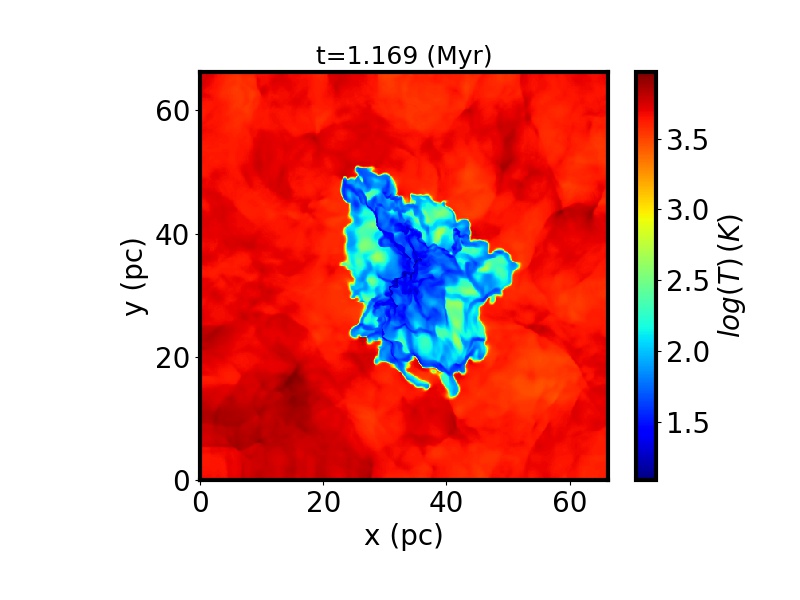
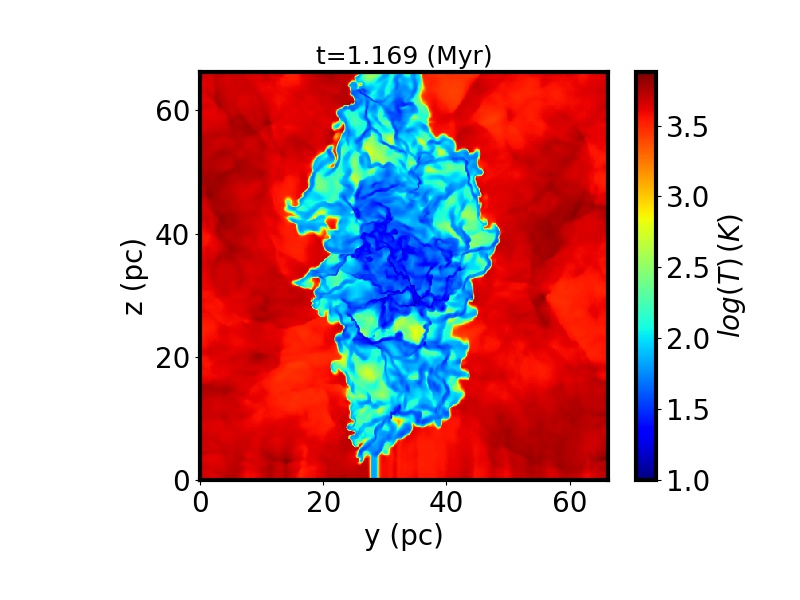
Temperature in the xz-plane.
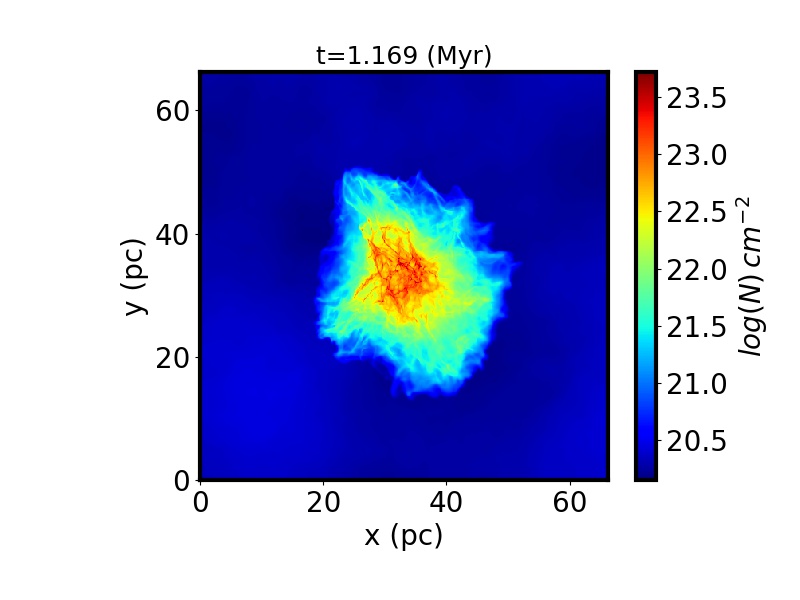
Column density along the x-direction.
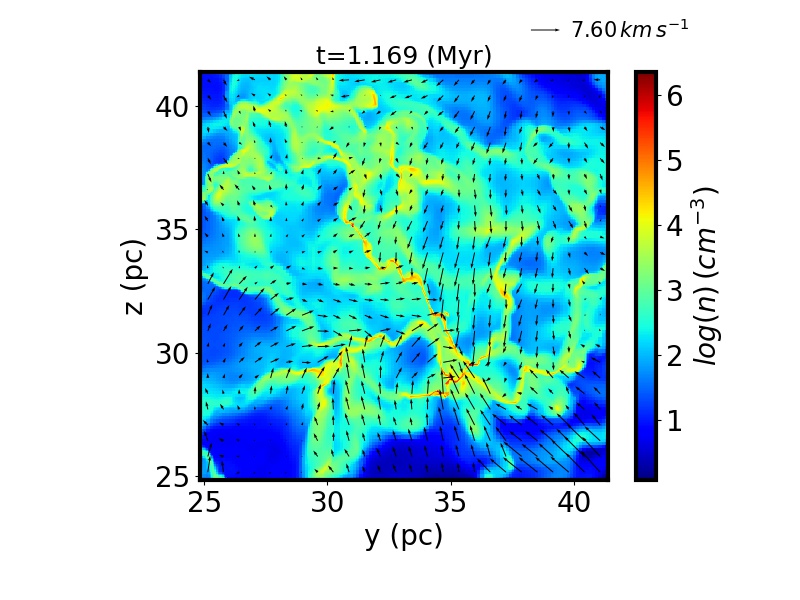
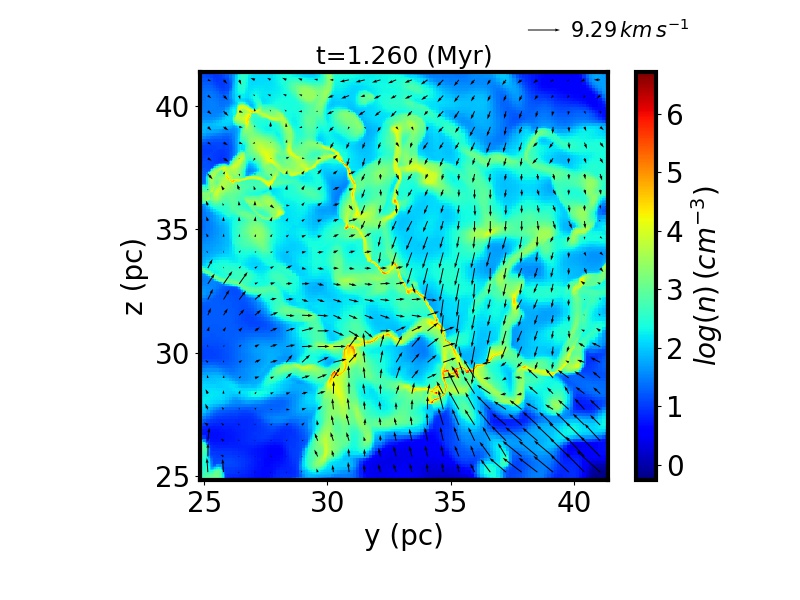
Density in the yz-plane. The arrows represent the velocity field in the yz-plane.
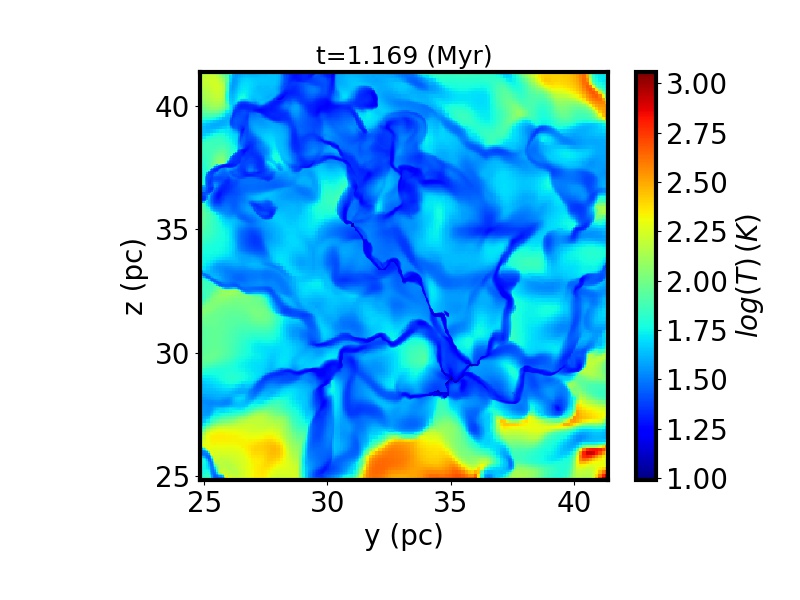
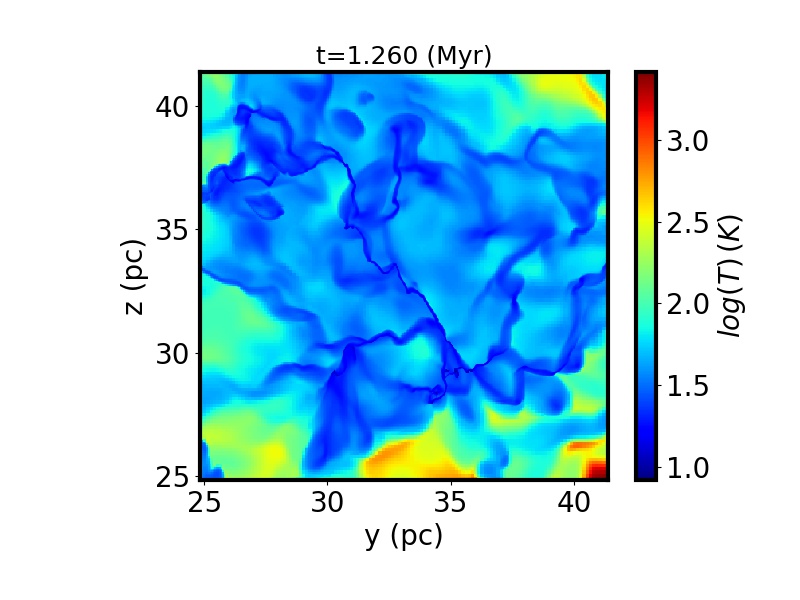
Temperature in the yz-plane.
Column density along the z-direction
Density in the xy-plane. The arrows represent the velocity field in the xy plane.
Temperature in the xy-plane.
Column density along the y-direction.
Density in the xz-plane. The arrows represent the velocity field in the xz-plane.
Temperature in the xz-plane.
Column density along the x-direction.
Density in the yz-plane. The arrows represent the velocity field in the yz-plane.
Temperature in the yz-plane.
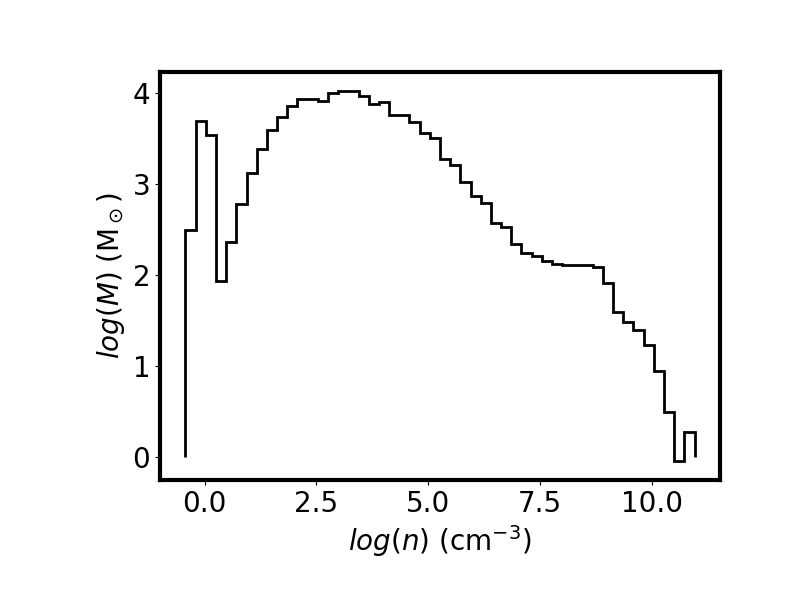
Mass weighted density PDF.
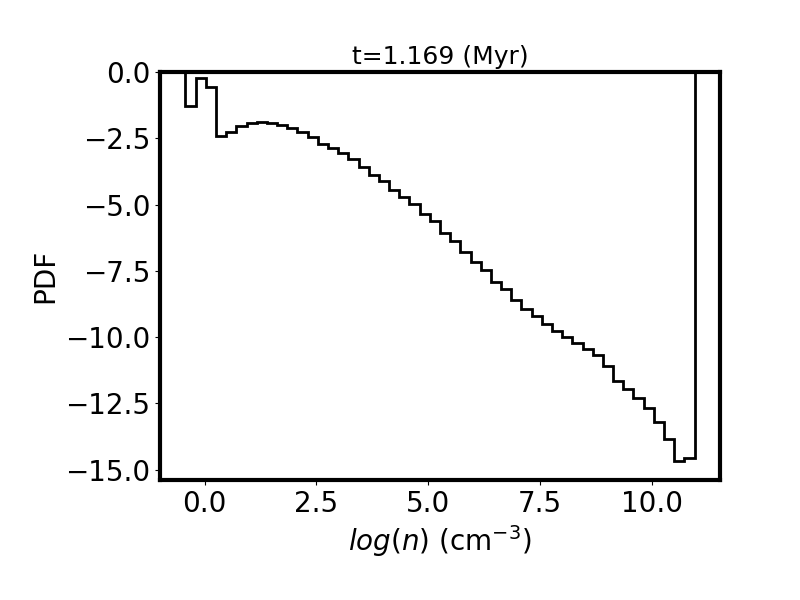
Volume weighted density PDF.
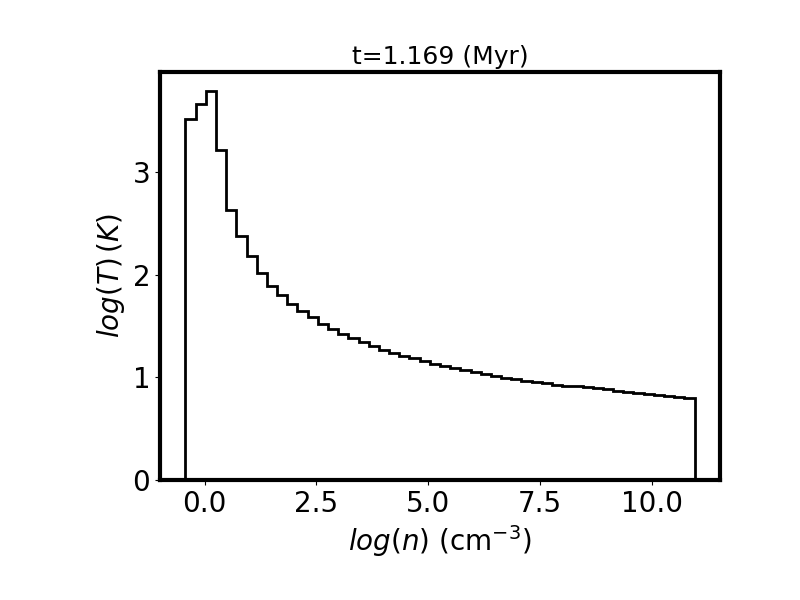
Mass weighted temperature.
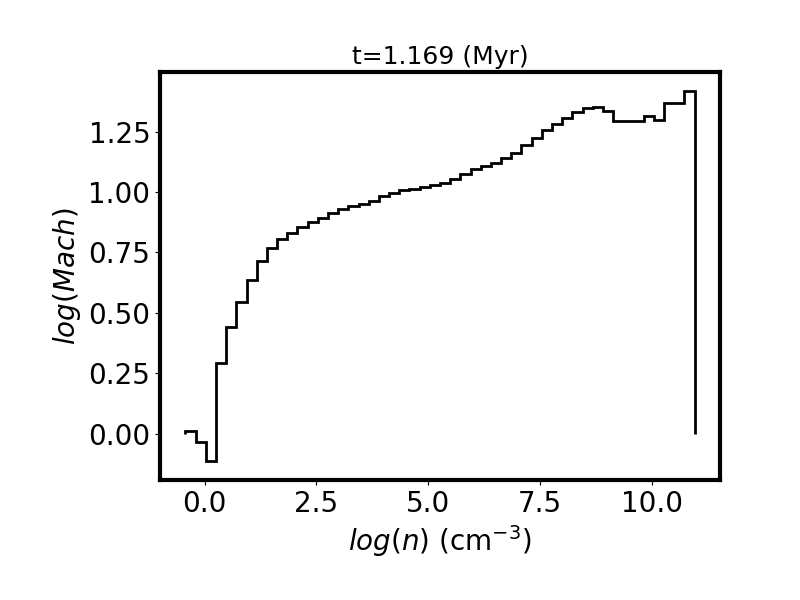
Mass weighted Mach number.
Mass weighted bidimentional histogram of the temperature vs density
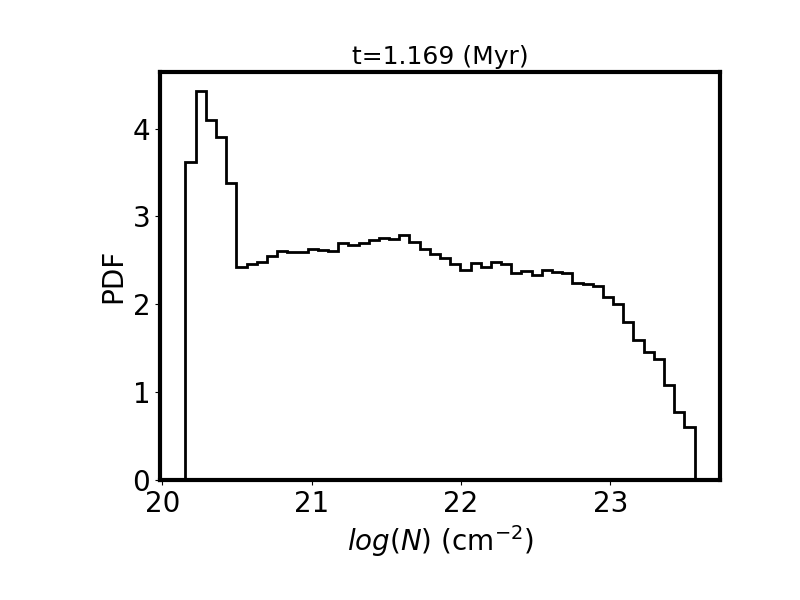
Surface weighted column density PDF.
ORION_00087 (t=$1.26079 \; \textrm{kyr}$)
descrip_snapshot
Catalogs :
Datafiles:
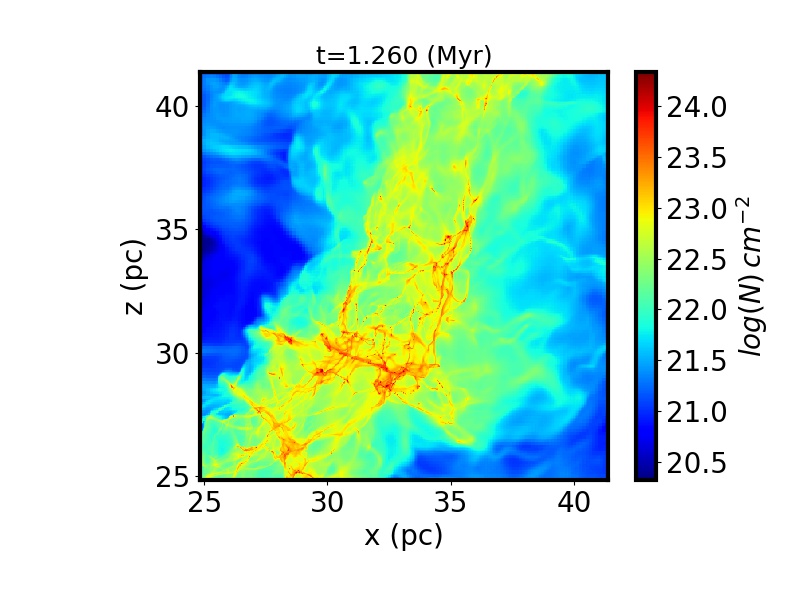
Column density along the z-direction
Density in the xy-plane. The arrows represent the velocity field in the xy plane.
Temperature in the xy-plane.
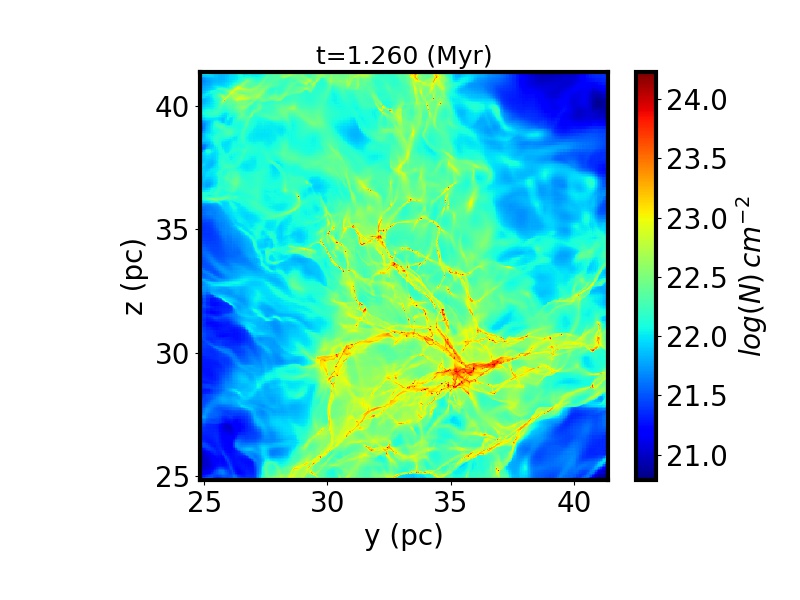
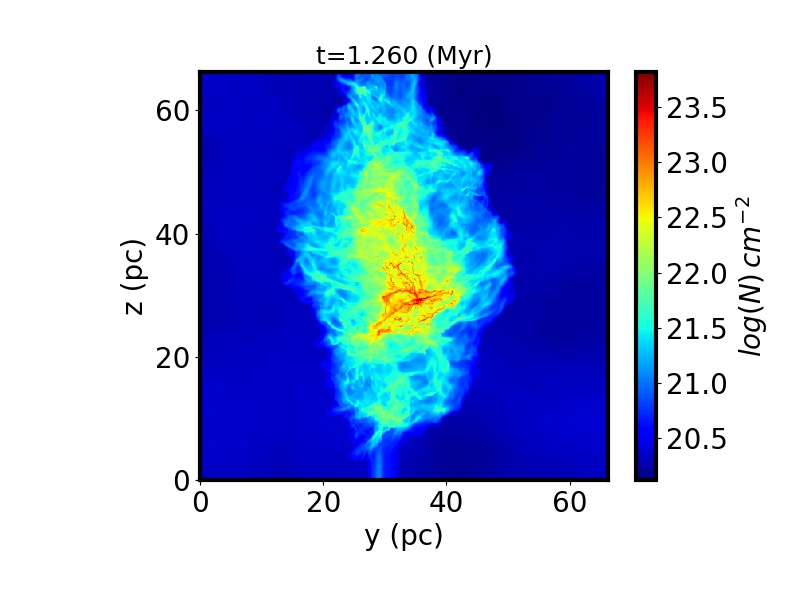
Column density along the y-direction.
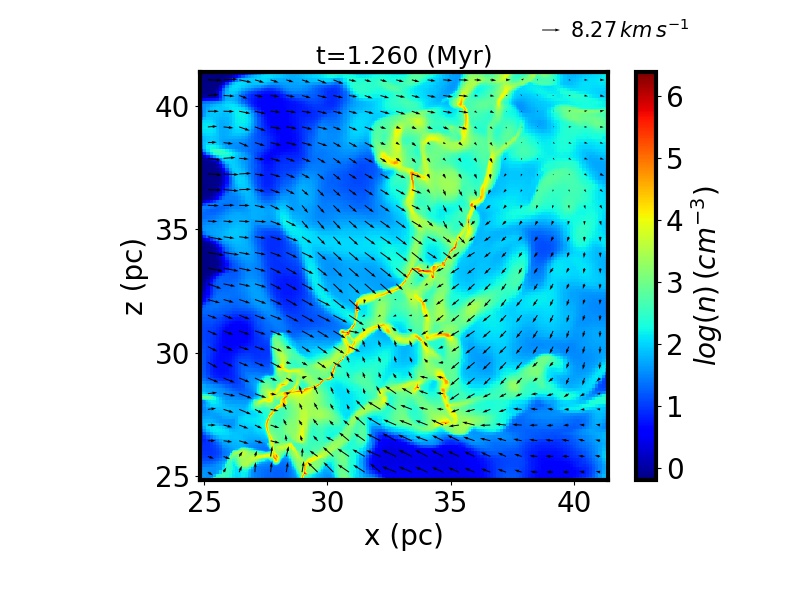
Density in the xz-plane. The arrows represent the velocity field in the xz-plane.
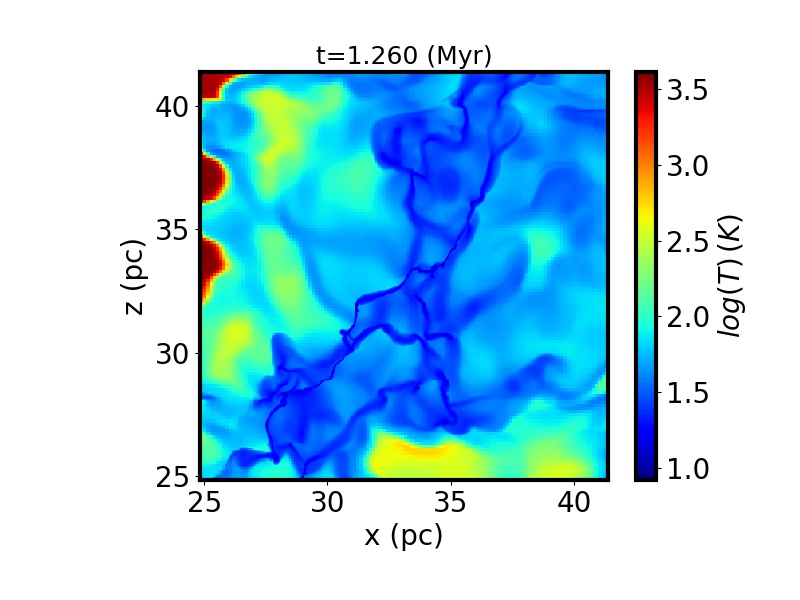
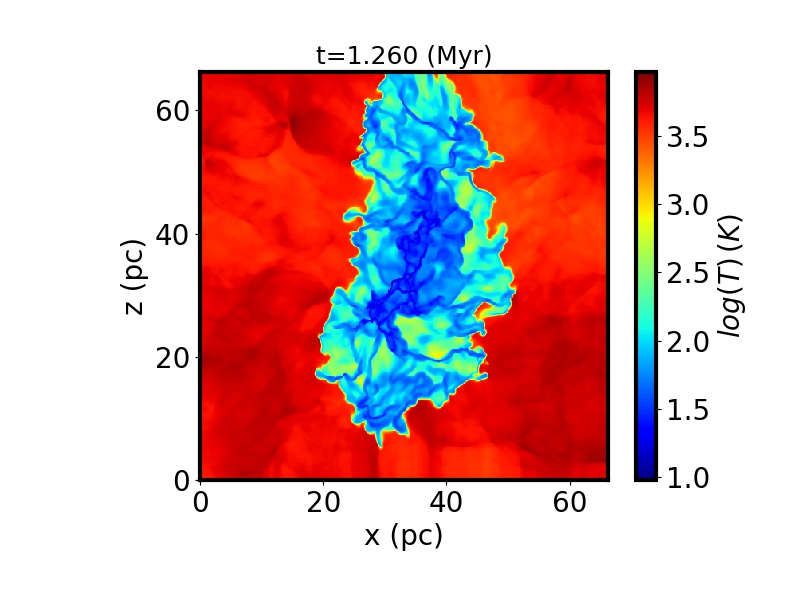
Temperature in the xz-plane.
Column density along the x-direction.
Density in the yz-plane. The arrows represent the velocity field in the yz-plane.
Temperature in the yz-plane.
Column density along the z-direction
Density in the xy-plane. The arrows represent the velocity field in the xy plane.
Temperature in the xy-plane.
Column density along the y-direction.
Density in the xz-plane. The arrows represent the velocity field in the xz-plane.
Temperature in the xz-plane.
Column density along the x-direction.
Density in the yz-plane. The arrows represent the velocity field in the yz-plane.
Temperature in the yz-plane.
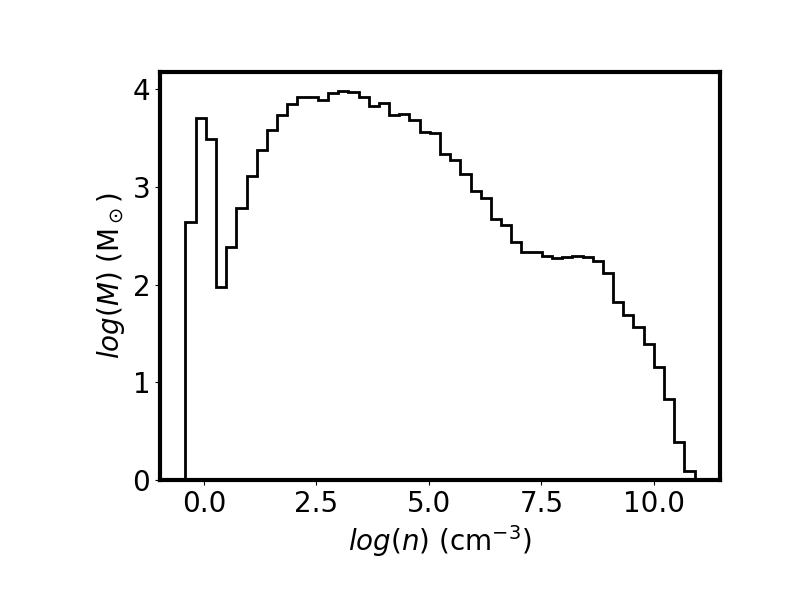
Mass weighted density PDF.
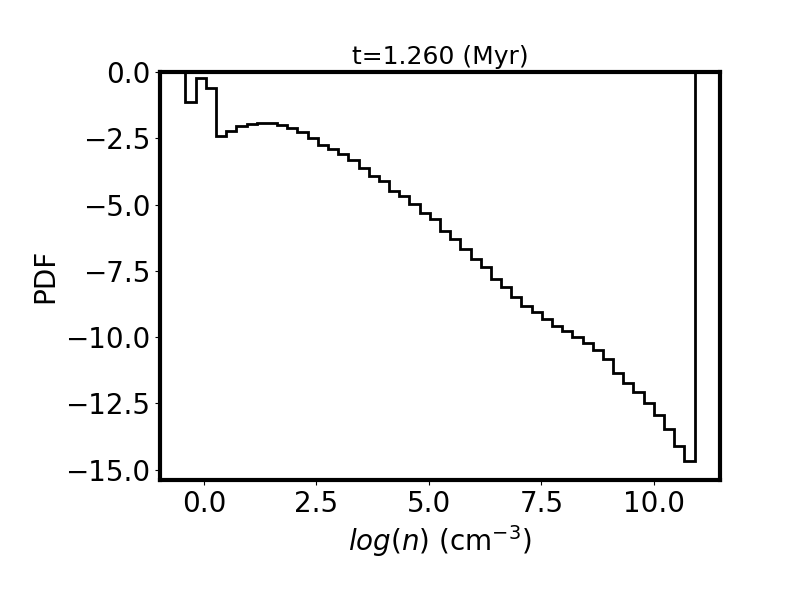
Volume weighted density PDF.
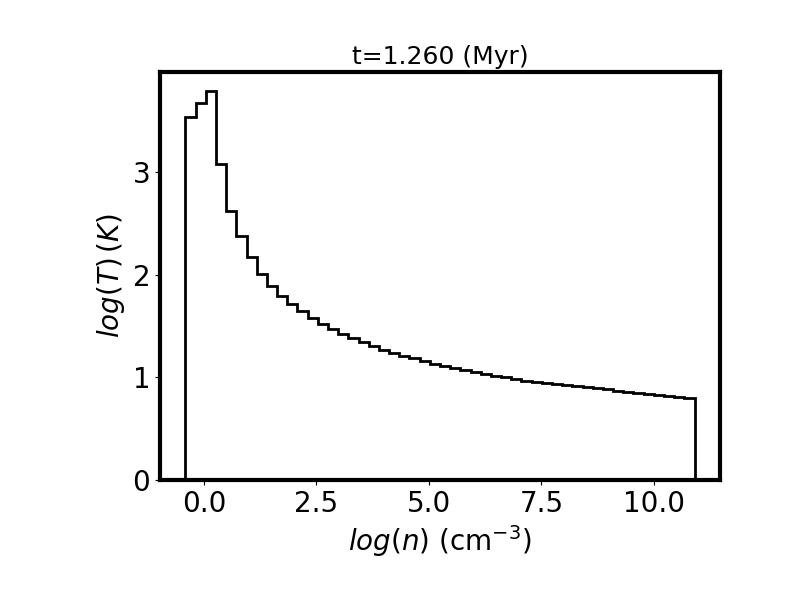
Mass weighted temperature.
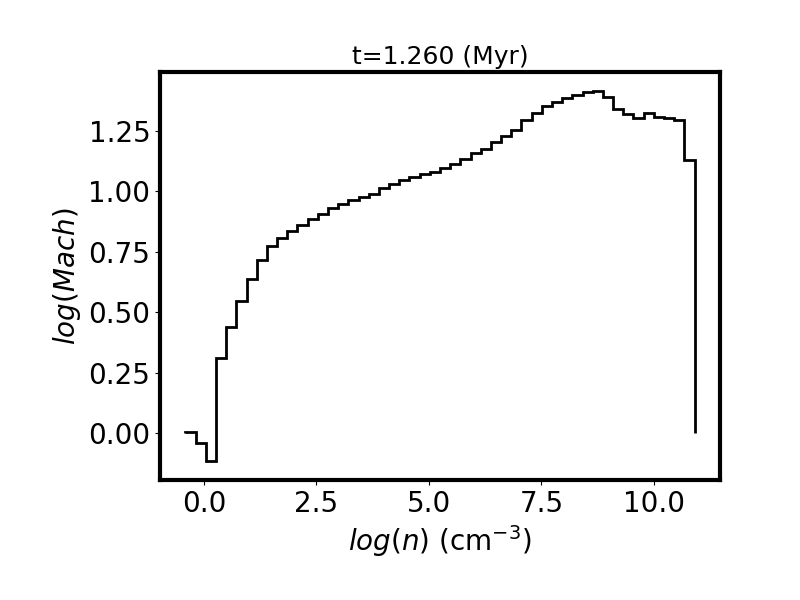
Mass weighted Mach number.
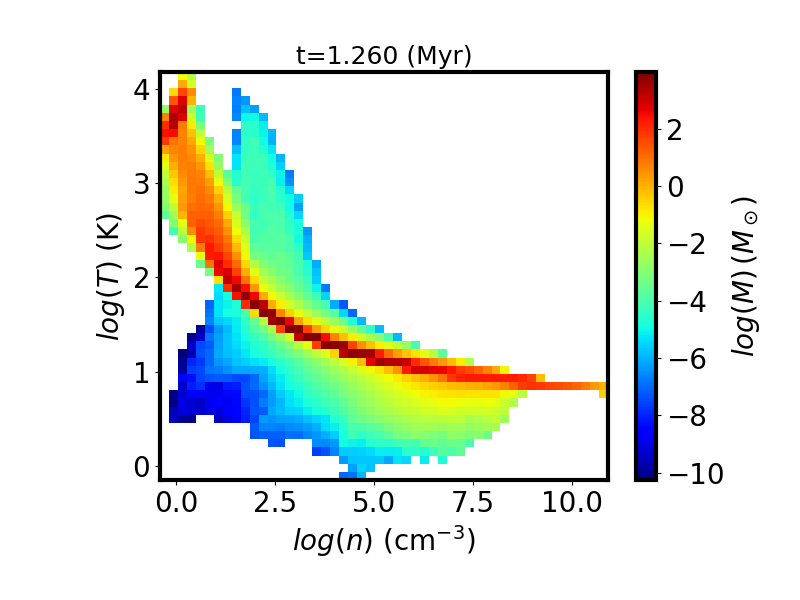
Mass weighted bidimentional histogram of the temperature vs density
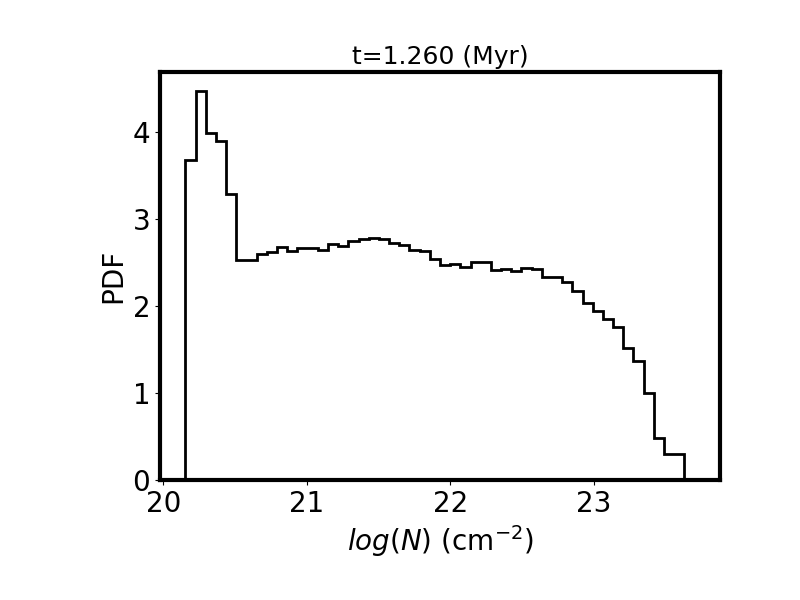
Surface weighted column density PDF.
